Guillermo Marin came to the 9th Annual Imagine Science Film Festival in New York to present his latest film Simulados. Executive Director of the festival Alexis Gambis meets up with him to discuss his work as a data visualization artist in Barcelona.
Watch Supercomputing and eScience on Labocine
Tell us a bit more about the videos presented today on Labocine?
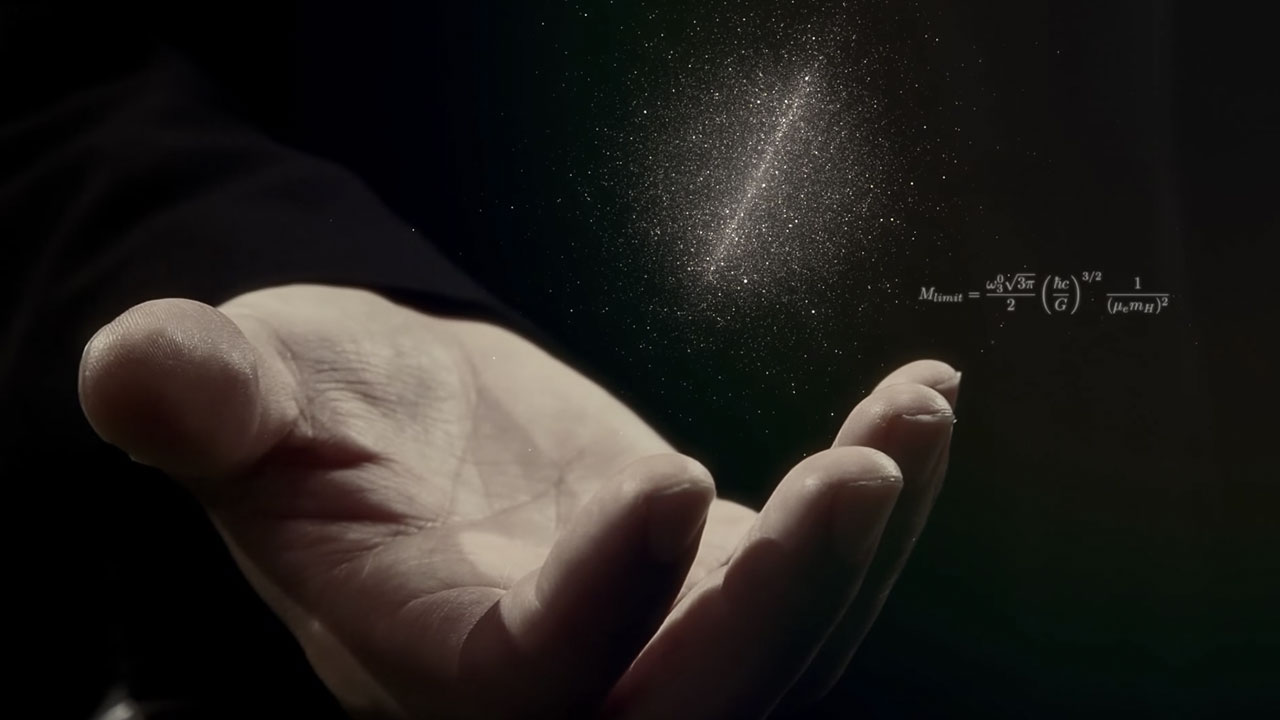
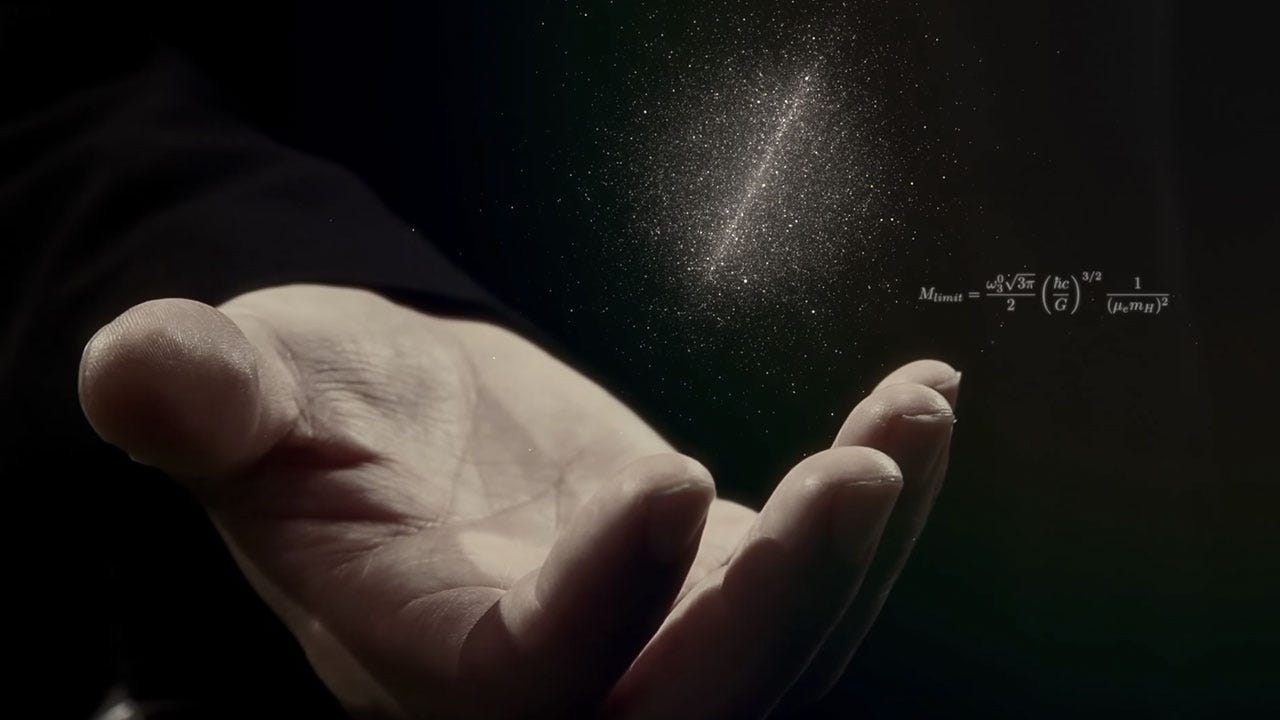
These videos were made by the Visualization Group of the Barcelona Supercomputing Center, where I am film director and visualization artist. At the group, our mission is to help scientists to communicate their projects to society and to their peers by creating compelling visualizations of their data. The videos reflect that vision because in all four the data is the star, as it is in all our projects.
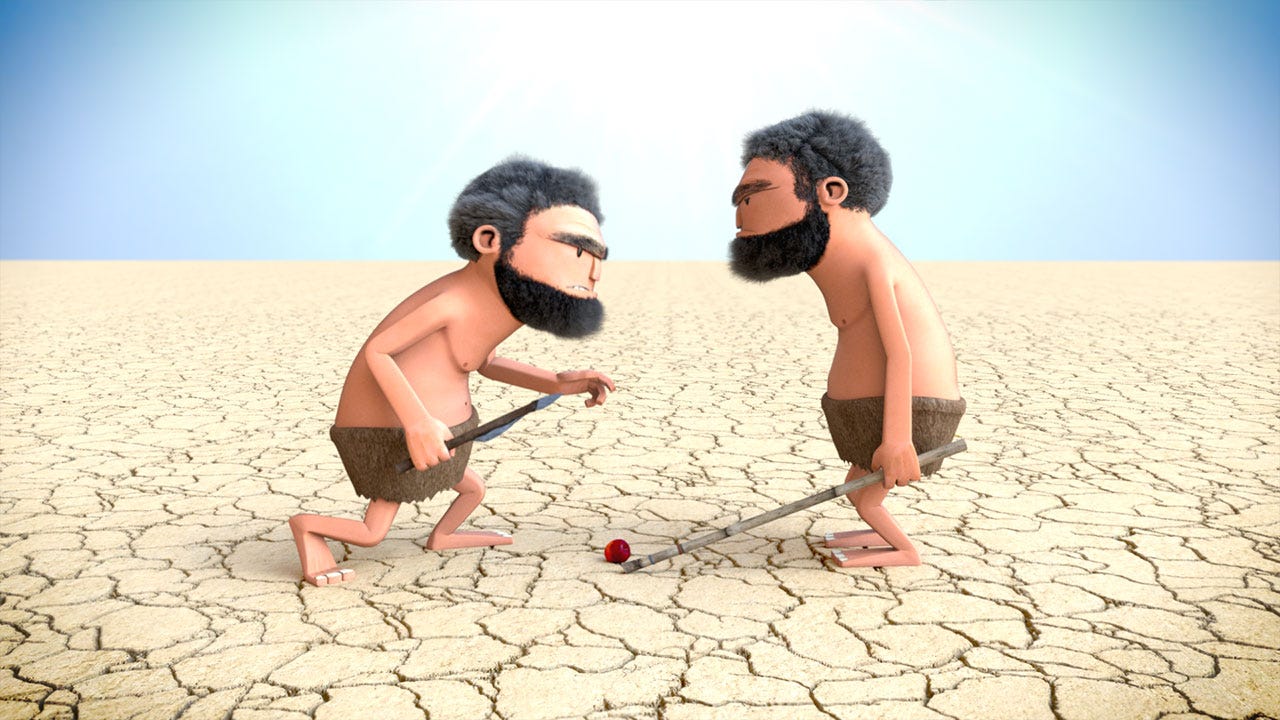
Watch Simulados on Labocine
In what context were these films made and what is the target audience? How have films been received?
The films feature scientific projects developed at or coordinated by the BSC and are aimed primarily to a general public. However, we try to make “multilayer” videos. It means that we try to add multiple layers of information so they can be enjoyed by a naive audience, but are also suitable for an expert. And the reception has been great in that range: most of our videos have been showcased or awarded in scientific film festivals, or used by scientists in conferences, but also watched by non-expert audiences in dissemination magazines, tv shows, online press, and so on.
How is imaging and creating these short animations/documentaries/films important for the scientific community and broader public?
Short films are very effective vehicles to communicate science to both types of audiences but they only go so far regarding technical weight, regarding depth. Our films intend to make people aware of these scientific projects, but also to make them want to learn more about it through other sources. Besides, for some projects we’ve developed interactive data visualizations instead of videos because we considered that this platform was more suitable for them.
It is the case of Atracktion that lets users explore a database of music popularity over the last 50 years in the US, or the Campanian Ignimbrite that explains a project to simulate a volcanic super-eruption. And they have the same goals: communicate in an appealing way and create an interest for more.
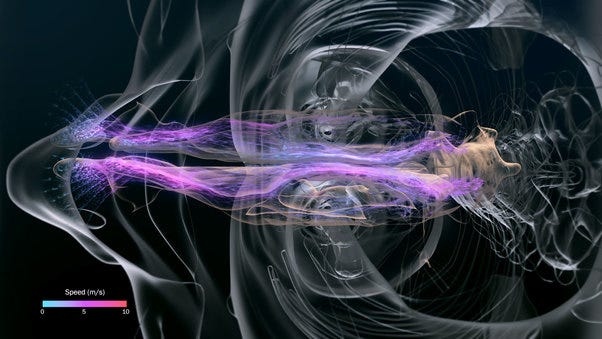
Watch Alya Red on Labocine
About the Author
Guillermo Marin is Lead Artist at the Visualization Group of the Barcelona Supercomputing Center, the Spanish national supercomputing facility. As part of the Visualization Group, he has directed and co-directed several scientific dissemination short films and visualizations. Some of those have been awarded or selected in prestigious events like the NSF Visualization Challenge, the Academia Film Olomouc (AFO), and the Imagine Science Film Festival.
With a background in Fine Arts and Computer Animation, Guillermo has worked in the animation production industry for several years in either independent short films and commercial projects, and in almost all stages of an animation production, from script writing and concept art, to animation and rendering.
Currently, he applies his experience to create appealing and informative data visualizations. Guillermo is also co-director and lecturer in the Master in Computer Animation of Universitat Pompeu Fabra, in Barcelona.